Smart energy monitors provide unprecedented visibility into your home’s electricity consumption, transforming vague utility bills into actionable insights about exactly where your energy goes. In 2026, these devices range from simple outlet monitors tracking individual appliances to whole-home systems identifying every device’s consumption without individual sensor deployment. This comprehensive guide explains how energy monitoring works, compares top products across different monitoring approaches, and shows you how to translate monitoring data into genuine energy savings.
I. Understanding Home Energy Monitoring
Before comparing products, understanding the different approaches to energy monitoring helps you select the right type for your goals. Monitoring can happen at the whole-home level, circuit level, or individual appliance level—each approach provides different insights with different installation complexity.
A. Whole-Home Monitoring
Whole-home monitors measure total electricity flowing into your home through sensors attached to your main electrical panel. This provides a complete picture of consumption without needing sensors on every device, but requires electrical panel access for installation.
Current transformer (CT) sensors clamp around the electrical wires feeding your home without cutting or modifying the wires. These sensors measure electrical current flowing through the cables, translating that into power consumption data. Most whole-home monitors use CT sensors ranging from under $100 for basic systems to $300+ for sophisticated disaggregation systems.
Disaggregation technology in advanced monitors analyzes the electrical signatures of different devices, identifying what’s consuming power without individual device sensors. Every electrical device creates a distinctive pattern—your refrigerator’s compressor has a different electrical signature than your air conditioner or washing machine. Machine learning algorithms recognize these signatures, breaking down total consumption into per-device or per-category estimates.
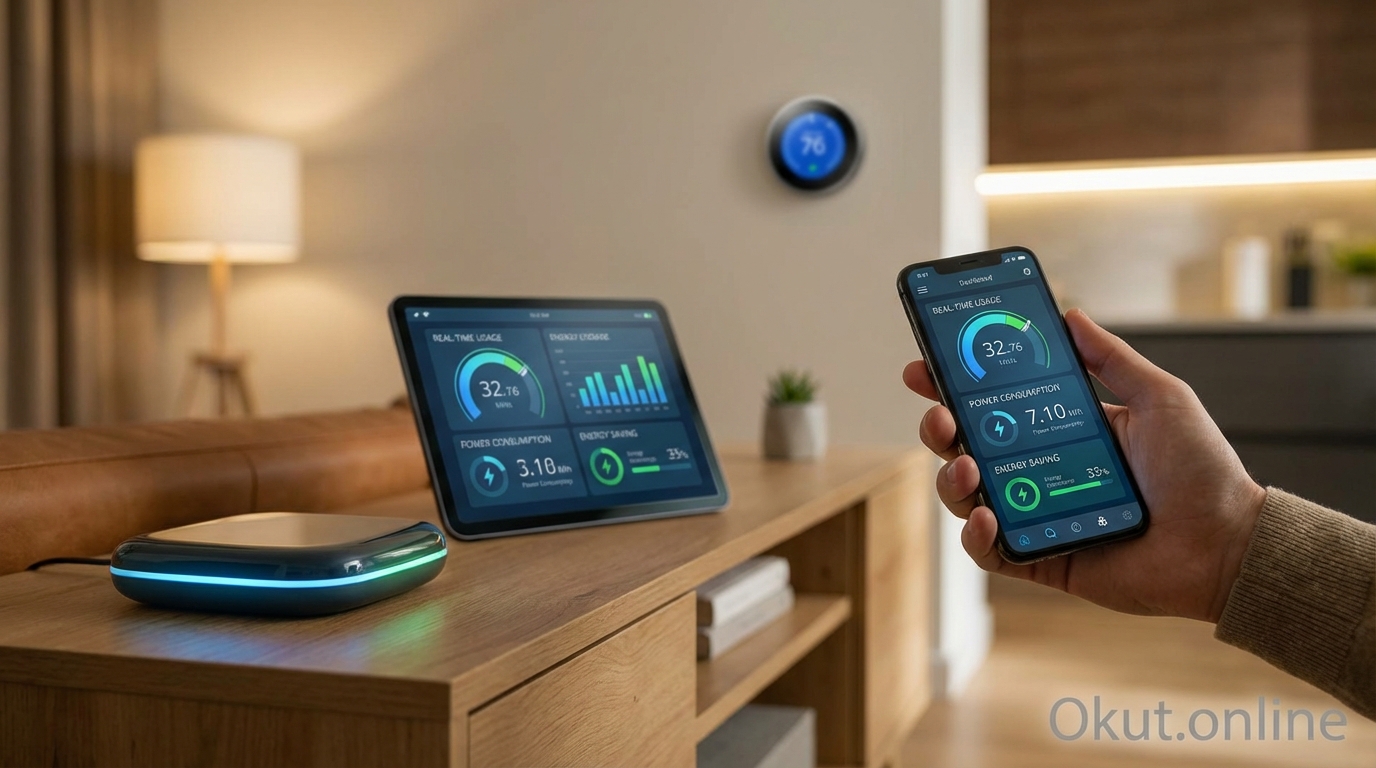
Real-time visibility shows consumption as it happens rather than waiting for monthly utility bills. Seeing the power spike when your dryer starts or the constant draw of devices you thought were off changes your understanding of where energy goes.
B. Circuit-Level Monitoring
Circuit-level monitors attach sensors to individual circuits in your electrical panel, providing detailed consumption data for each circuit without the complexity of disaggregation algorithms.
Installation requires access to your electrical panel and sensors for each circuit you want to monitor. Full-home coverage might need 16-40+ sensors depending on your panel configuration. This approach is more invasive than whole-home monitoring but provides higher accuracy than disaggregation estimates.
Per-circuit data shows consumption for groups of outlets or dedicated circuits. You’ll know exactly how much your kitchen uses, your HVAC system consumes, or your garage draws—though circuits serving multiple outlets still aggregate those devices together.
Historical trending over circuits helps identify unusual consumption patterns. If your “always-on” basement circuit suddenly starts drawing significantly more power, something has changed worth investigating.
C. Individual Appliance Monitoring
Plug-in monitors measure consumption of individual devices by sitting between the outlet and the device’s plug. This approach requires no electrical panel access and provides exact per-device data.
Smart plugs with energy monitoring combine outlet control with consumption tracking. You can monitor your refrigerator’s consumption AND automate other devices using the same smart plug ecosystem.
Standalone energy monitors focus exclusively on measurement without smart control features, often providing more detailed consumption displays or data logging at lower costs than full smart plugs.
Scalability challenges make this approach impractical for monitoring everything—you’d need dozens of monitors. Most users select high-priority devices (HVAC equipment, refrigerators, entertainment centers, computers) for individual monitoring rather than attempting comprehensive coverage.
II. Top Whole-Home Energy Monitors (2026)
Whole-home monitors provide the broadest visibility with the least per-device installation effort, making them the starting point for most serious energy monitoring projects.
A. Sense Energy Monitor – $299
Sense pioneered consumer-accessible machine learning disaggregation, using AI to identify individual devices from whole-home electrical data.
Device detection through machine learning is Sense’s core innovation. The monitor learns your home’s electrical signatures over time, gradually identifying individual devices. Initial detection might recognize your refrigerator and HVAC system within days; smaller devices take weeks or months to detect accurately.
Real-time consumption display shows total home consumption with identified devices highlighted when active. Watch power spike when you turn on appliances; see exactly what your “always-on” baseline includes as Sense identifies background consumers.
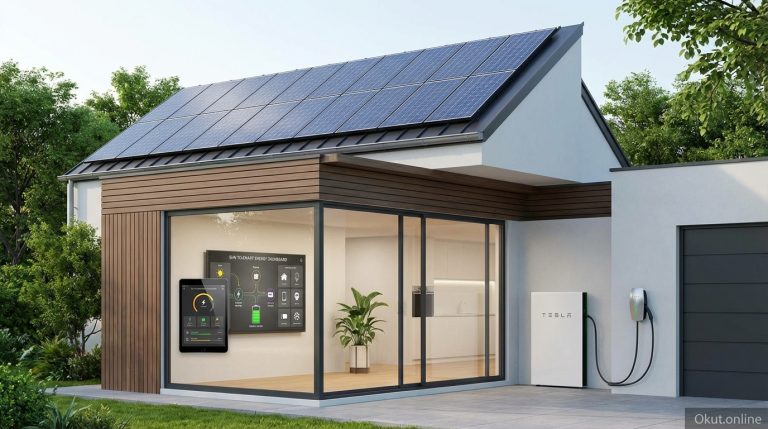
Solar edition ($349) adds solar production monitoring for homes with photovoltaic systems, tracking both production and consumption to show net energy position. This provides visibility into whether you’re generating surplus for export or drawing from the grid at any moment.
Installation requires attaching CT sensors to your main electrical feeds in the panel and connecting the monitor to Wi-Fi. The process is DIY-accessible for those comfortable working near electrical panels; others may prefer professional installation.
Detection limitations exist—Sense typically identifies 15-25 major devices over several months but may miss smaller or rarely-used devices. Detection accuracy varies by home; some users see excellent identification while others find detection disappointing.
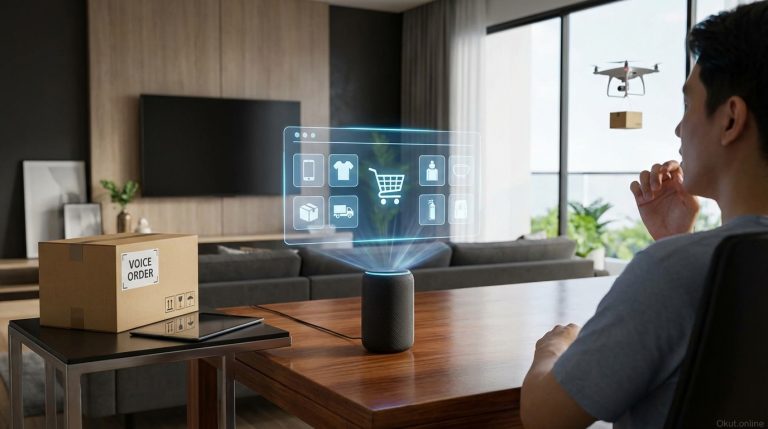
Integration with Alexa and Google Home enables voice queries about home energy consumption. Smart home integration through IFTTT and direct API access enables automation based on consumption data.
B. Emporia Vue Energy Monitor – $99
Emporia offers exceptionally affordable whole-home monitoring, with options for adding circuit-level sensors incrementally.
Basic Vue ($99) includes CT sensors for whole-home monitoring without disaggregation. You’ll see total consumption in real-time but won’t get per-device breakdowns without additional sensors.
Vue with expanded monitoring allows adding 8 or 16-sensor expansion kits ($79-139) for circuit-level monitoring. This hybrid approach starts affordable and expands as desired, eventually providing per-circuit visibility throughout your home.
Smart plug integration through Emporia’s smart plugs adds device-level monitoring for key appliances, combining whole-home baseline with detailed tracking for specific devices you select.
App-based analysis provides consumption tracking, comparisons to previous periods, and cost calculations based on your utility rates. The interface is straightforward without the machine learning complexity of Sense.
Solar monitoring support tracks solar production when CT sensors are added to solar feed circuits, though less elegantly integrated than Sense’s dedicated solar edition.
Value proposition makes Emporia the entry point for budget-conscious energy monitoring. The core monitor costs one-third of Sense, delivering essential whole-home visibility even if it lacks sophisticated device identification.
C. Eyedro Home Energy Monitor – $149
Eyedro provides straightforward whole-home monitoring with particular strength in historical data access and utility cost tracking.
Real-time monitoring shows consumption with responsive updates as devices turn on and off. The web-based dashboard and mobile app display current usage, historical trends, and cost projections.
Time-of-use rate support calculates costs accurately for utility plans with different rates at different times of day. If your utility charges more during peak hours, Eyedro shows actual costs based on when you consume energy.
Bill forecasting estimates upcoming utility bills based on consumption patterns, helping you understand mid-cycle whether you’re tracking toward normal bills or concerning increases.
Data export provides CSV downloads of consumption data for external analysis, spreadsheet tracking, or integration with other energy management tools.
No device disaggregation means you see total consumption only—Eyedro doesn’t attempt to identify individual devices. This simplicity reduces complexity but limits actionable insights compared to systems that can point to specific consumption sources.
III. Circuit-Level Monitoring Systems
For users wanting accuracy beyond disaggregation estimates without monitoring every individual device, circuit-level systems provide detailed visibility with reasonable installation effort.
A. Emporia Vue Gen 2 with Expansion
Emporia’s expanded system combines whole-home monitoring with per-circuit visibility through flexible sensor expansion.
16-sensor expansion allows monitoring 16 individual circuits beyond the main feeds. For a typical home, this might cover major circuits like HVAC, water heater, dryer, kitchen, each bedroom circuit, and several general purpose circuits.
Mix-and-match flexibility means you can monitor circuits you care about most without covering every circuit. Most meaningful consumption comes from a subset of circuits; focusing sensors there provides most value without maximum complexity.
Stacking expansions for larger panels—homes with 30+ circuit panels can add multiple expansion modules, eventually achieving comprehensive coverage of all circuits.
Per-circuit cost attribution shows which circuits consume the most, both in energy and dollars. This clarity helps prioritize efficiency improvement efforts on highest-impact areas.
B. IoTaWatt Energy Monitor – $139
IoTaWatt appeals to technically-inclined users wanting maximum flexibility and local data control.
14-channel monitoring supports up to 14 CT sensors, typically covering 12 individual circuits plus both main legs of split-phase service.
Local data storage keeps consumption data entirely on your home network, never uploading to external clouds. Privacy-conscious users and those wanting data control appreciate this approach.
Open-source integration enables data export to Home Assistant, InfluxDB, Emoncms, and other platforms. Build custom dashboards, create sophisticated automations based on consumption data, or feed data into broader home energy management systems.
DIY-oriented approach means the IoTaWatt lacks the polished app experience of consumer-focused alternatives. Configuration happens through web interfaces rather than mobile apps, and troubleshooting may require more technical knowledge.
Scalability through additional units allows expanding beyond 14 channels by adding more IoTaWatt devices, eventually covering even large commercial panels.
IV. Individual Device Monitors
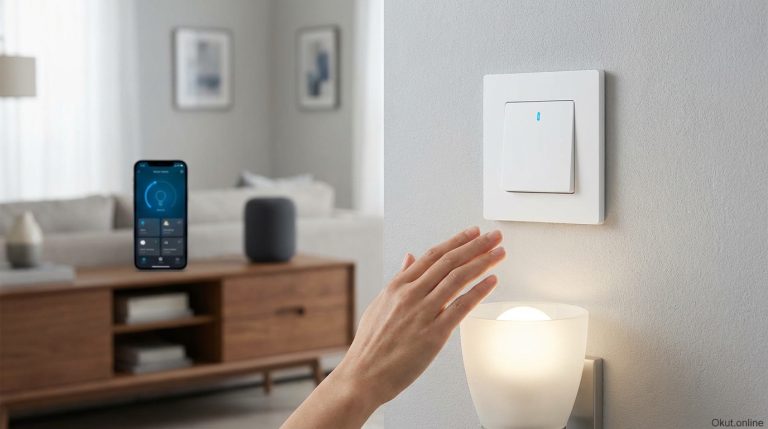
Smart plugs with energy monitoring provide precise per-device consumption data for specific appliances you select, complementing whole-home or circuit-level monitoring.
A. Emporia Smart Plug – $17
Emporia’s smart plugs integrate with their energy monitoring platform, providing unified consumption data across whole-home, circuit, and individual device levels.
Energy monitoring tracks consumption for devices plugged into the smart plug, showing real-time and historical usage through the Emporia app.
Smart outlet functionality enables scheduling, automation, and remote on/off control independent of energy monitoring.
Platform integration means device-level consumption appears alongside whole-home data in the same app, providing comprehensive energy visibility.
Value pricing at $17 per plug makes monitoring individual devices affordable for key energy consumers throughout your home.
B. TP-Link Kasa Smart Plug with Energy Monitoring – $25
Kasa smart plugs provide reliable energy monitoring with broad smart home compatibility.
Consumption tracking shows real-time power draw, daily usage, weekly usage, and monthly totals. The Kasa app displays consumption trends and calculates costs based on your entered utility rate.
Alexa and Google Home integration enables voice control and routine integration. Ask Alexa about power consumption or trigger automations based on usage patterns.
Away mode and scheduling help reduce energy consumption by automatically turning devices off when not needed or simulating occupancy for security.
Reliability reputation makes Kasa a trusted choice for smart plug deployment, with consistent connectivity and app performance that some competitors struggle to match.
C. Kill A Watt EZ Electricity Monitor – $35
For simple, dedicated energy measurement without smart features, the Kill A Watt provides straightforward monitoring for individual devices.
Plug-in operation requires no app, no Wi-Fi, no account—simply plug the Kill A Watt into an outlet, plug your device into the Kill A Watt, and read consumption on the built-in display.
Cost calculation displays accumulated energy cost based on your entered utility rate. Leave the Kill A Watt connected for days or weeks to understand actual device consumption over time.
Diagnostic measurements include voltage, current, watts, frequency, and power factor—useful for understanding not just how much energy a device uses but how it uses it.
No smart features means no remote access, no automation, and no data logging beyond what’s displayed. This simplicity appeals to users wanting basic measurement without smart home complexity.
V. Translating Data Into Energy Savings
Monitoring provides data; savings require action. Understanding how to interpret monitoring data and implement changes transforms information into reduced utility bills.
A. Identifying Energy Hogs
Energy monitors reveal consumption patterns that utility bills hide, exposing devices drawing more power than expected.
Always-on loads—the power your home consumes 24/7 even when you think everything is off—often represent the biggest savings opportunity. Cable boxes, computers in standby, phantom loads from device transformers, and old appliances maintaining unnecessary states can easily total 100-300 watts continuous.
Inefficient appliance identification occurs when you see exactly how much old refrigerators, aging HVAC systems, or inefficient water heaters consume. A 25-year-old refrigerator might use 150% more energy than a modern replacement; seeing the actual numbers makes replacement ROI calculations concrete.
Behavioral discoveries emerge from real-time monitoring. That 2-hour gaming session uses more electricity than you expected; the basement dehumidifier running 24/7 is costing $30/month; the hot tub heating costs more than your imagination suggested.
B. Time-of-Use Optimization
Many utilities charge different rates for electricity at different times. Energy monitoring helps optimize consumption timing to minimize costs.
Identify peak-rate consumption by reviewing when your highest usage occurs. If expensive peak rates apply 4-9 PM and you’re running dryers, dishwashers, and EV charging during those hours, shifting to off-peak times saves money without reducing consumption.
Automate time-based shifting using smart plugs and scheduling. Set the dishwasher to run overnight, schedule EV charging for midnight, or delay laundry until off-peak periods. Smart home automation makes timing optimization require no daily thought.
Pre-conditioning before peak periods reduces the need for expensive peak energy. Run air conditioning more aggressively before peak rates begin, then coast through peak hours with accumulated cooling. Similar strategies work for water heaters, pool pumps, and other deferrable loads.
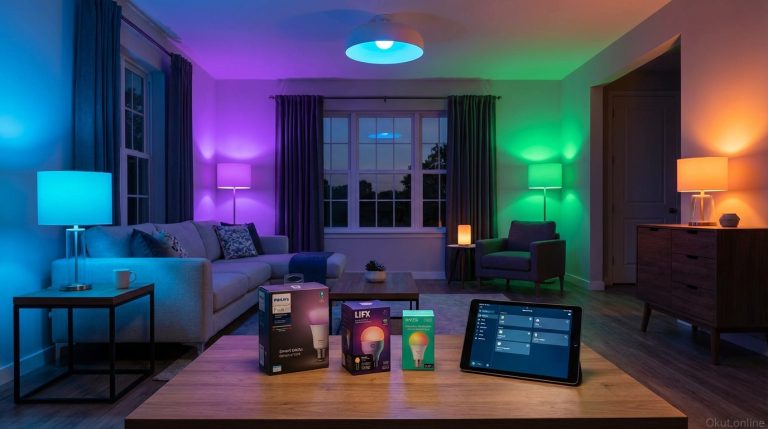
C. Eliminating Phantom Loads
Phantom loads—power consumed by devices that appear off but remain energized—can total hundreds of dollars annually. Energy monitoring identifies these vampires.
Common phantom loads include cable boxes (20-30W even when “off”), game consoles in standby (10-25W), computers in sleep mode (5-15W), and device chargers left plugged in (1-5W each). Individually small, collectively significant.
Smart power strips enable cutting power to device groups when not in use. Entertainment center power strips can kill phantom loads from multiple devices with a single switch; home office setups can power down overnight without individual device management.
Scheduled automation through smart plugs eliminates phantom loads during sleeping hours or work hours when devices aren’t needed. A computer setup that consumes 15W phantom load overnight wastes 4 kWh monthly—cutting that power overnight saves trivially but accumulates meaningfully.
D. Tracking Improvement Impact
After implementing changes, monitoring validates whether improvements delivered expected savings.
Before/after comparison shows whether replacing that old refrigerator actually reduced consumption as expected. Real data replaces assumptions about improvement effectiveness.
Regression detection catches when consumption creeps back up. Maybe seasonal changes, maybe behavioral drift, maybe equipment issues—monitoring reveals the change so you can investigate and respond.
Goal tracking using monitoring data keeps efficiency efforts focused. Set consumption targets and watch progress toward hitting them; celebrate successes documented by actual data.
VI. Solar and Generator Integration
Homes with solar panels, battery storage, or backup generators gain additional value from energy monitoring that tracks both production and consumption.
A. Solar Production Monitoring
Solar-capable energy monitors show production alongside consumption, revealing net energy position and enabling optimization.
Real-time net metering shows whether you’re currently exporting surplus to the grid or drawing grid power despite solar production. This visibility helps schedule high-consumption activities during peak production.
Production vs. consumption analysis identifies opportunities to better utilize solar production. If you’re exporting power at noon (low value) but drawing grid power at dinner time (higher value), shifting loads toward solar production hours saves money.
System performance monitoring detects when solar production drops unexpectedly, potentially indicating panel issues, shading problems, or inverter failures worth investigating.
B. Battery Storage Optimization
Homes with battery storage can use consumption monitoring to optimize when batteries charge and discharge.
Charge from solar when production exceeds consumption; discharge to cover evening consumption when solar production drops. Monitoring provides the intelligence for smart battery controllers to make these decisions.
Time-of-use arbitrage charges batteries during cheap rate periods and discharges during expensive periods, independent of solar. Consumption monitoring helps size this strategy to actual load patterns.
VII. Common Mistakes to Avoid
- Expecting Instant Disaggregation: Machine learning device detection takes weeks to months to identify devices. Expecting immediate insights leads to disappointment with capable systems that simply need time to learn.
- Monitoring Without Acting: Data without action changes nothing. Commit to reviewing monitoring data regularly and implementing changes, not just collecting information.
- Over-Investing in Monitoring: A $300 monitor tracking consumption in a home with minimal efficiency improvement opportunity may never pay for itself. Match monitoring investment to realistic savings potential.
- Ignoring Baseline Load: Many users focus on spikes from major appliances while ignoring the always-on baseline. That constant 200W draw costs more annually than occasional high-power events.
- DIY Electrical Panel Work Without Competence: Installing CT sensors in electrical panels involves proximity to lethal voltages. If you’re not comfortable and competent with electrical work, hire professionals rather than risking injury.
VIII. Practical Tips for Energy Monitoring Success
- Start with Whole-Home Baseline: Before monitoring individual devices, understand your total consumption patterns. This baseline helps you prioritize which devices deserve individual monitoring.
- Monitor Major Appliances First: HVAC, water heaters, refrigerators, and dryers typically dominate residential consumption. Monitor these first rather than scattering attention across minor loads.
- Set Weekly Review Reminders: Schedule time to review monitoring data regularly. Initial interest fades without structured attention; weekly review maintains focus on efficiency goals.
- Benchmark Against Neighbors: Some monitoring systems show neighborhood comparisons. Understanding whether your consumption is typical or unusual provides context for evaluation.
- Calculate ROI Before Purchasing: Estimate potential savings before buying monitoring equipment. If realistic savings are $10/month, a $300 monitoring setup takes 30 months to pay back—worthwhile, but set expectations accordingly.
IX. Conclusion
Smart energy monitors transform vague utility bills into actionable visibility about exactly where your electricity goes. Whole-home systems like Sense provide broad consumption awareness with intelligent device detection; budget-friendly options like Emporia Vue make monitoring accessible at any budget; circuit-level systems provide detailed accuracy without individual device sensors. The real value emerges when monitoring data drives action—eliminating phantom loads, shifting consumption to off-peak hours, identifying inefficient appliances for replacement, and verifying that efficiency improvements deliver expected results. Whether you choose sophisticated disaggregation systems or straightforward smart plugs on key appliances, energy monitoring is the foundation for intelligent energy management that reduces consumption, lowers bills, and minimizes environmental impact.
What’s your biggest energy mystery—the consumption you know exists but can’t explain? Which monitoring approach would help you solve it? Share your energy questions in the comments!